Description
This GUI offers dozens of utilities and communicates with a third-party API to get results related to travelling.
Features
The app GUI is dynamically generated, so that many of the dropdown menus, buttons, table-columns, etc. are re-generated dynamically depending on the process.
It consists of around fifteen thousands lines of code, completely written by me, which includes different algorithms such as word-best-matching, 3D representation with hidden elements, XML parsing, proccessing and formatting, dynamic calendar, etc.
All the functionality has been designed by me, without using any third-parties libraries.
Description
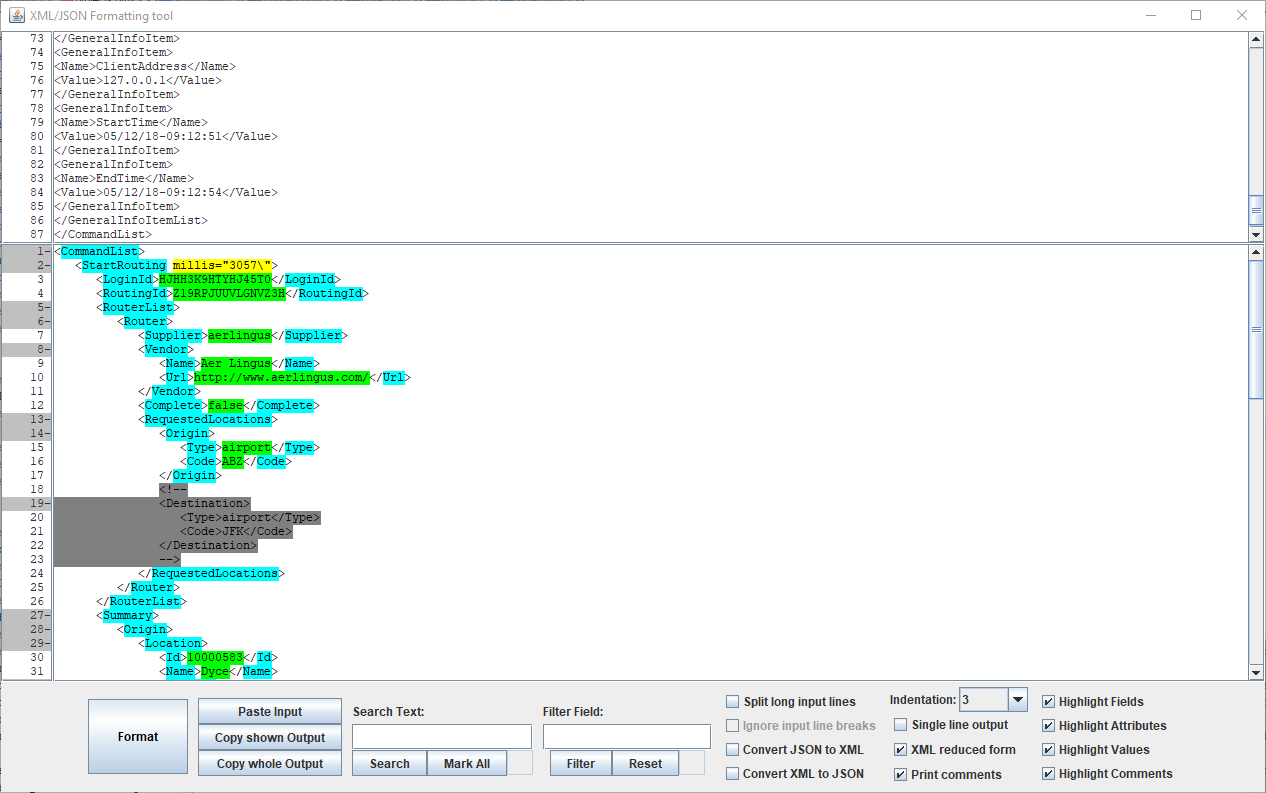
This GUI provides an off-line XML/JSON beautifier, which allows different formatting outpus (e.g. identantion type/size, break-lines, highlighting of fields, values, attributes and/or comments), and is able to convert between XML and JSON.
Features
Both libraries for XML and JSON have been developed by myself, providing advanced features such as descendant access, or conversion between XML and JSON in both directions. The conversion allows skipping (but storing) XML comments within the JSON object and proccesses properly multiple children with same name (grouping them when needed), and XML attributes when present.
The app has searching capabilities, highliting all the matches, or allowing the extraction of specific elements and offering the iteration through them.
It also integrates smart functionality for collapsing and expanding elements.
All the functionality has been designed by me, without using any third-parties libraries.
Description
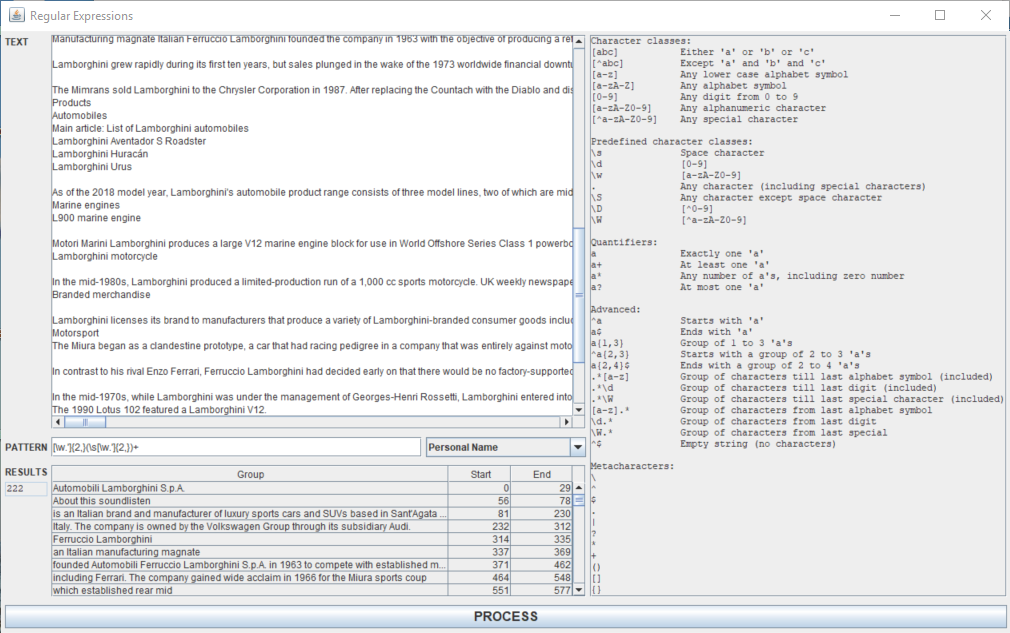
This is a simple GUI that allows any text as input, and then proccess a Regular Expression to find all the existing matches.
Features
It offers a dropdown menu with typical Regular Expressions that can be pre-selected, but also manipulated, or allows the manual input of a customized regex.
The output is tabulated showing all the matches, including the matching substring, the start index and the end index from the input text.
Description
This app is similar to the corresponding Object Pascal one, which I have rewritten in Java under a 100% object-oriented approach.
Even though the application is still not completely finished, it provides the main features, and outstands over the previous one with the use of multithreading when processing the shares of a country.
Features
This app provides the same features to the homologous one developed in Object Pascal, described below. Nonetheless, some of the algorithms have been reviewed, improving the way the data is stored in memory, and reducing the amount of memory required to keep the data.
The main improvement and most relevant feature is the use of multithreading: different threads are generated dynamically at runtime, depending on the number of processors (but there is flexibility for other criteria). Each thread is responsible for downloading and analysing one or more shares. Therefore the time required for getting and processing the information is reduced significantly compared to the Object Pascal app.
Another interesting feature is that this app has been designed to be 100% flexible with any screen resolution (responsive), and therefore the size (and number) of diagrams shown on the screen will depend on the device. The app has been designed with the aim of being used in a desktop PC, in a tablet or in a smartphone. There will be a future version in Android.
The rest of the features and performance are similar to the Object Pascal app, outstanding the generation of hundreds (or thousands) of diagrams automatically, which position depends on the sorting criteria selected by the user.
Future planned features
I am currently integrating database functionality, so that the historical data is stored in a database, which is updated only with the most recent data, or overriding when the prices are adjusted. It uses the Hibernate framework.
Production of a version for the Android platform.
Description
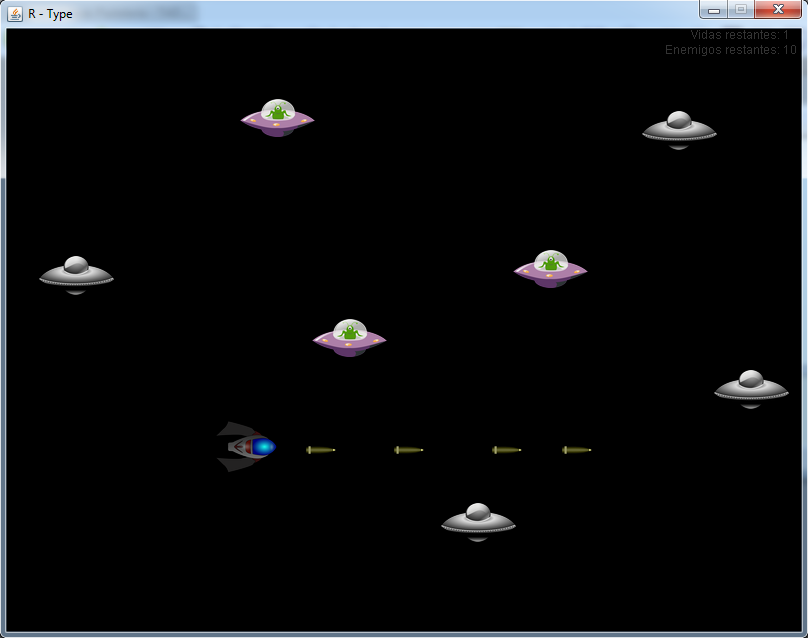
This app is a simple version of the R-Type game, developed by myself during my first year studying Computer Science.
Features
This game uses the main features of OOP (inheritance, polymorphism, etc) and the common data structures.
There are typical features related to this kind of games, such as clash detection of objects, random behaviour of enemies, etc.
Description
This app generates a Delaunay Triangulation from a cloud of points, lines or polylines. The input data can be provided as plain text files (points and lines with X, Y, Z values) or from an AutoCAD .dxf file. Besides the triangulation, it provides tools to get longitudinal and transverse sections through user-specified polylines.
It consists of thousands of lines of code, completely written by myself.
Features
This app is able to process an undefined huge amount of data (millions of points), determining dynamically the required size of vectors and matrices. The algorithms have been designed providing the maximum possible performance (better than many commercial triangulation software applications).
The triangulation points are doubly sorted and filtered according to the user parameters (e.g. removing points which proximity to others is less than a certain tolerance).
The app allows to use of an undefined huge amount of breaklines for constraining the triangulation. A specific powerful algorithm have been written from scratch (non-based on any previous existing solutions) to deal with whatever configuration of breaklines, providing a high performance and without any triangulation issues (in opposition to some commercial solutions).
The app is able to load an AutoCAD .dxf file, processing any kind of item (such as 3D splines, arc of ellipses, etc.), generating its geometry from the provided parameters and getting 3D points along the item according to the user parameters (such as max. deflexion between 3 consecutive points, maximum distance, etc.). The application also gets the layer and representation parameters, in order to shown the items in a 3D OpenGL scene.
The app allows the generation of contour lines (same level Z). An elaborated algorithm has been designed to analyse the triangulation and generate continuous 2D polylines for each required level.
The app allows the generation of longitudinal and cross sections with different input parameters. Each section can be defined by a 2D polyline with whatever geometry, and the corresponding algorithm is able to generate the cross section, incorporating the corresponding break points. This feature is not usually available on the commercial software alternatives.
The app can generate as output plain text files with the triangulation information, and/or a .dxf file with all the required information (points, 3d faces of triangulation, contour lines, etc.). For the generation of the .dxf file, a specific algorithm has been written using an external template prepared by myself.
Future planned features
Possibility of filtering layers, blocks or type of entities from the input .dxf file, to be taken into account for the triangulation.
The OpenGl module for representing the data has been integrated, but still some features are to be implemented in the future.
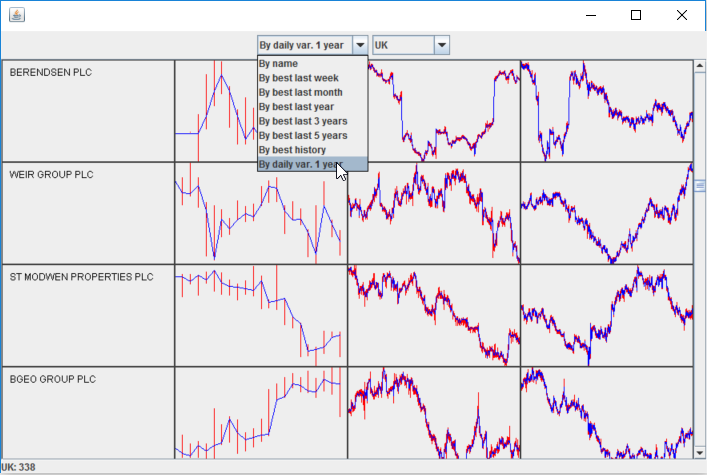
Description
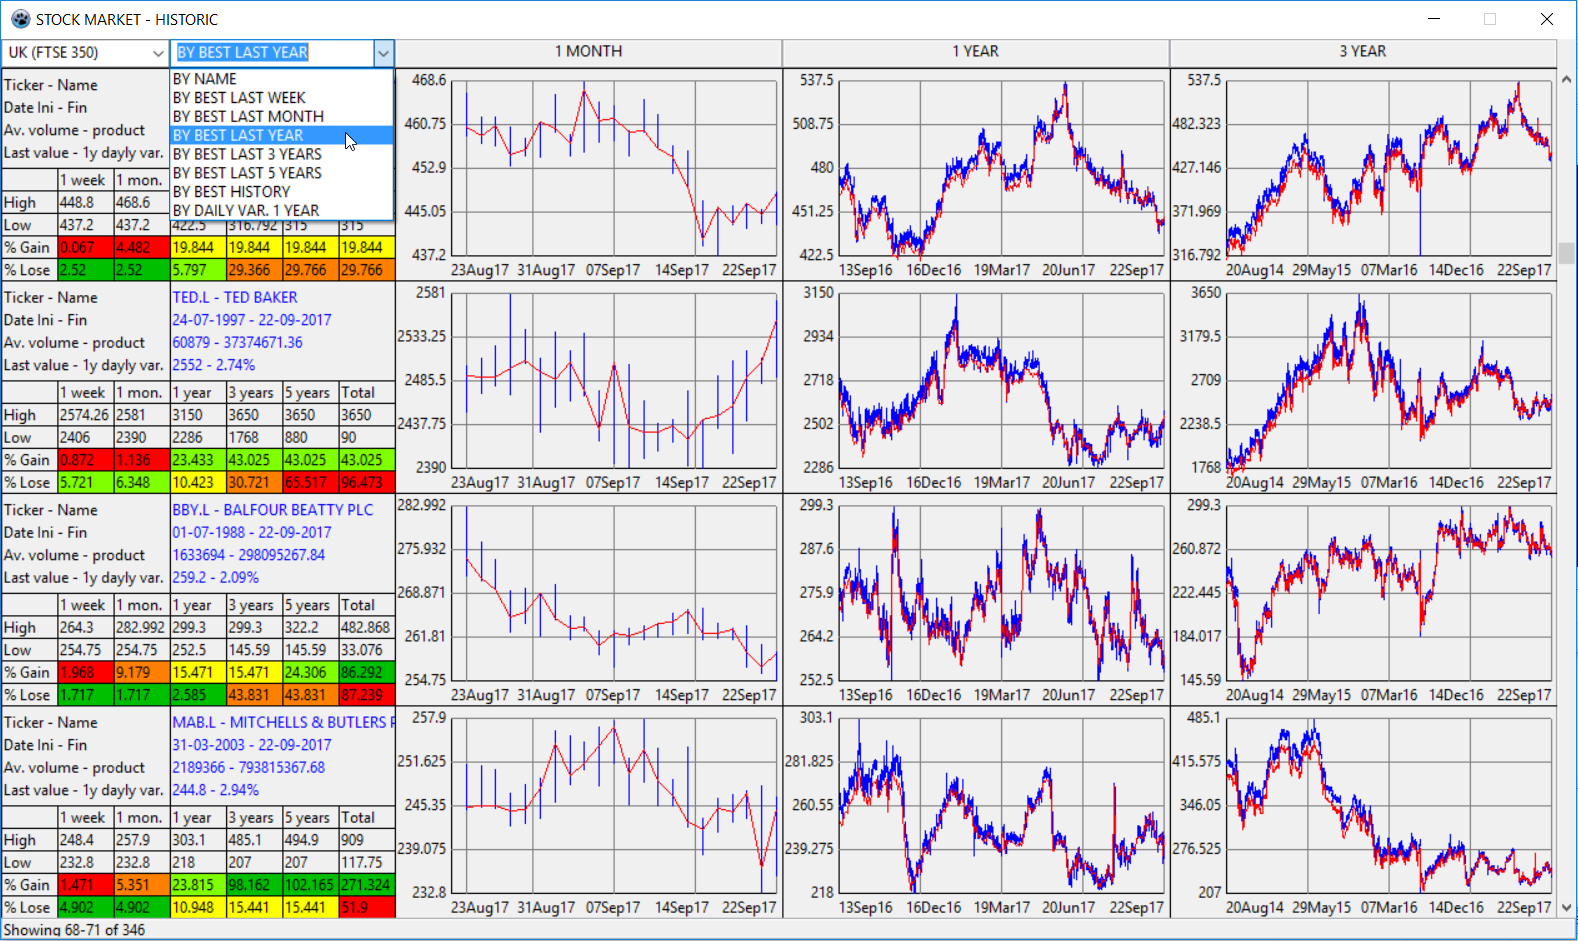
This app provides the user with a graphic interface to select one of the available countries and get all the historical data of all its market shares (e.g. FTSE 350 in United Kingdom). The historical data is got from an internet website supplier, for each one of the shares in the market, and then the data is analysed getting different statistic parameters, which allow sorting all the country shares by different criteria.
The information is represented graphically to facilitate its interpretation.
Features
This app is able to get via streamers a significant amount of information from internet (e.g. 350 .csv files from UK stock market) and then process all the available historical data from each one of the shares (there can be thousands of values within a single share).
The app processes with high performance algorithms the data, sorting and storing only the required information for the app’s purposes. Different statistic parameters are assessed for each one of the shares.
Once all the shares of a country are processed and the statistical parameters calculated, an advanced algorithm processes the shares, sorting them according to seven different criteria. The user can select the preferred criteria for representing the data, in order to decide which shares can be of interest for investing.
Thousands of diagrams are generated automatically every time the user selects a criteria: for each share a table with values and colours is shown, plus three different diagrams showing the historical data for different periods.
An additional feature was originally available, providing real-time interactive diagrams for a selected share, getting real-time information directly from the internet provider every certain timeslots. Although this was the most amazing feature, it is currently blocked due to the non-availability of the real-time information from the internet provider.
Even though the huge amount of diagrams generated, which are constantly redrawn every time the user scrolls or changes the sorting criteria, the app responds without any lag, due to high-performance algorithms designed by myself. The only time consuming task is getting the information from the internet supplier (hundreds of websites are consulted for each single country), but this process has also been optimized, and every country is stored during the whole session, so that when changing between countries, if a country was already processed it does not require to be processed again, until next session.
The app offers the possibility of storing locally the .csv files got from the data supplier, for their use with other tools (e.g. spreadsheets), but by default this option is disabled.
Future planned features
Adding additional countries. Currently I have incorporated the shares of seven countries (the ones I am considering for my personal investment interests at the moment). The app is completely well-designed and scalable, allowing adding any additional required country without breaking any existing code.
Making available again the real-time feature. For this purpose I will need to change to a different data supplier providing this real-time information.
Description
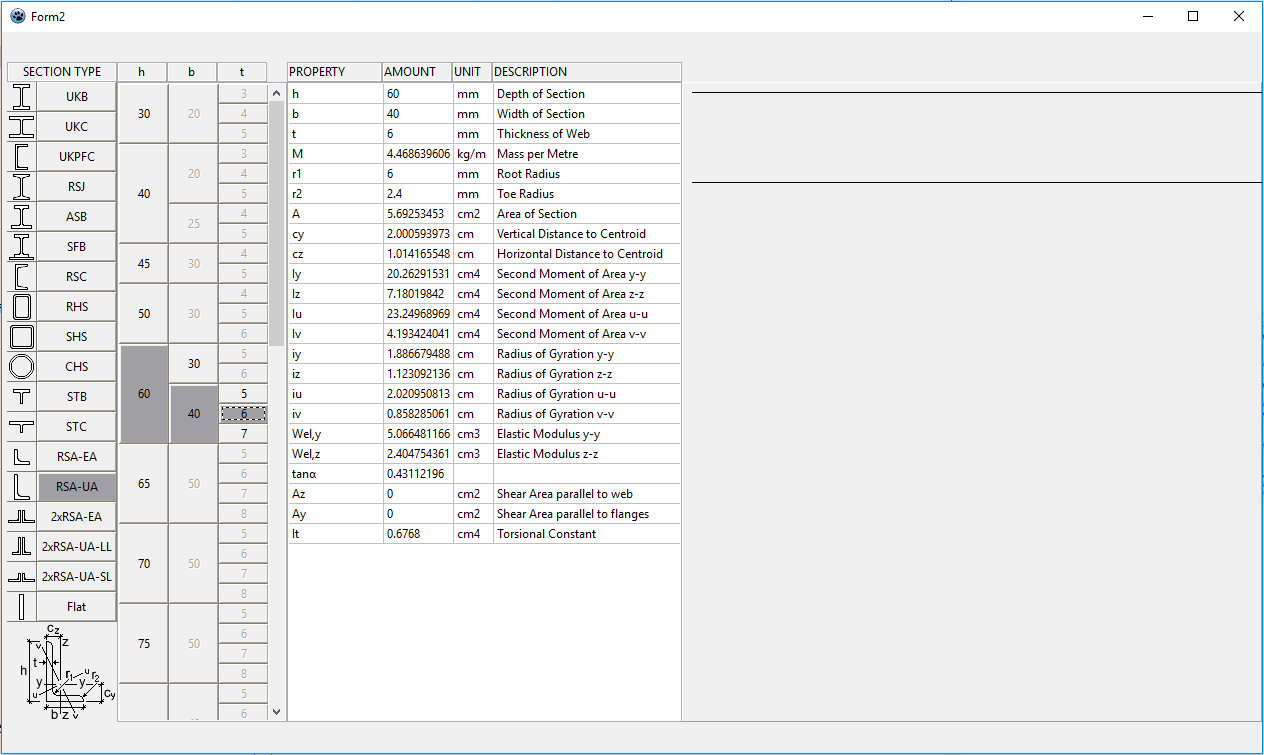
This app provides the user with a graphic interface to select any of the standard steel sections available in UK, and provides the sectional parameters which can be used for structural calculations.
Features
For designing this app, I had to prepare and organize a huge database with all the parameters of the available sections. The information is integrated within the code, in a separate class, which enables a high performance during the app usage.
The sections are sorted by type, which can be selected by their icon or name, and a schematic diagram is shown at the bottom for the selected type of section.
Considering that each type of section has a different number of available profiles, which are sorted within subgroups with different number of items, I had developed an ingenious way of generating dynamically all the buttons which allow the selections of every single section. In same cases there are thousands of buttons, and some of them with different sizes. Considering the groups and subgroups, some buttons are changed to blocked/unblocked automatically/dynamically, depending on the user selection.
There are thousand of buttons, but only a few methods implement the button events, based on the selections. The ingenious code provides a real-time performance, without any lags in showing the requested data.
The way of selecting a section is really efficient, allowing first selecting the type, then the first parameter of that type, then the second, and so on. Other commercial solutions do not provide such a sophisticated way of button arrangement, which facilitates the selection like this.
The data is provided within a table, which can be copied with Ctrl+C for future use within an spreadsheet or other tools/documents.
Future planned features
A canvas has been integrated for representing the real geometry of the selected section, but I have not written the corresponding graphing code yet, which is a pending feature. There will be different methods, depending on the different types of sections, with different types of geometries.
Additional features will be added, such as selection of steel parameters and external loading, in order to provide structural check of the section, or generating a list of possible sections which fit the structural and geometric requiriments, and sorted according to certain parameter (e.g. weight of steel, which is directly related to the cost).
Description
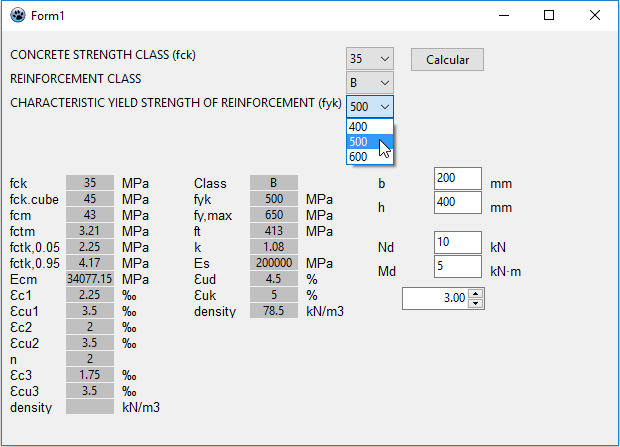
This app provides the user with a graphic interface for selecting the parameters of a certain reinforced concrete, to get its corresponding properties, which can be used in other structural calculations.
Features
This application has been designed with the aim of being incorporated within a bigger application for structural calculations.
It consists of the UK (Eurocode) database of reinforced concrete, stored directly within the code in a separate class. The data is accessed according to the user-selected parameters, providing the corresponding field information.
Future planned features
Although this app is to form part of a larger structural software, I also intended to provide an independent app for reinforce concrete querying. Future features to be incorporated can consist of sectional assessment, considering external forces, geometry of section and reinforcement layout and schedule.
Description
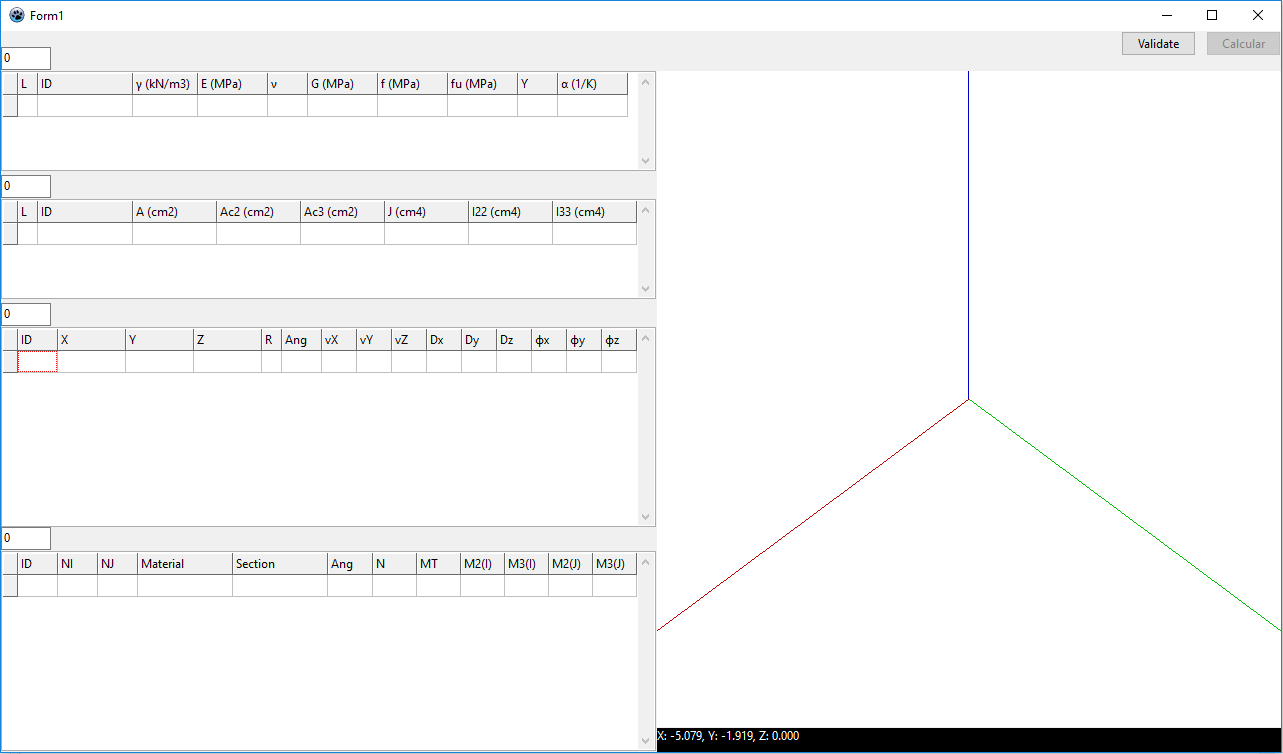
This is an app which development is in progress. Its goal is to provide an interface for defining a 3D matrix structure of nodes and links, including loadings, load-combinations and assessment.
Part of the input interface has been designed, including an OpenGL scene for representing 3D the structure.
Features
The input interface provides advanced features for a simplified introduction of the data, grouping the relevant fields in the same area for a quick access and modification.
The data can be introduced manually within the provided tables, or partially-generated automatically, as the tables are dynamic dependent on the preselected number of items.
The data can also be pasted directly with Ctrl+V from different sources (e.g. a spreadsheet). In the same way, the data can be copied to external spreadsheets or documents.
The cells have been constrained defining the correct ranges for each field (e.g. normal values of density, elastic modulus, etc.). The designed algorithms detect if duplicated data has been introduced (e.g. two points with the same coordinates).
For materials and sections areas, each (new) row can be generated accessing a library of available materials or typical sections (these depending on the selected material).
The values in an area are automatically restricted depending on the values provided within other related fields. For example, once we have created some materials, only these can be selected within the link parameters. In the same way, when defining the start and end points of a link, only the available previously created points can be selected.
Although the early stage of development of this piece of software, very powerful and advanced features have been implemented, which simplify the data introduction and remove any possibility of introducing wrong information. The above are only a few examples of the integrated features.
The OpenGL scene has been fully programmed by myself, coding how the visual perspective changes with the mouse movement, panning and scrolling. Advanced features have been added, such as dynamic zoom-scaling, depending on the zoom level. This feature is available in some powerful CAD commercial software, and I have coded it from scratch for this application.
Future planned features
A piece of software like this would require several months of full-time work, or even years for implementing all the features, considering just my collaboration. I have no intention to progress it at the moment, considering the required time, other projects I have in progress, and also the availability of very powerful matrix analysis software in the market (with big corporations behind).
Nonetheless, it was a really good practical exercise for me writing code with advance features for constraining fields, generating dynamic tables, and working with OpenGL.
Potential future features could be: providing automatic generation of typical parametric structures based on certain parameters (in a similar way as SAP 90 did years ago); including graphical input from the OpenGL scene (such as selecting points, CAD tools for drawing the structure, etc.); implementing all the algorithms related to the matrix calculations for the structure; and a big etc.
Description
It applies Artificial Intelligence search agents to find a route between two cities, given a database with cities and distances between them.
Features
It uses advanced data structures, such as AVL trees, and uses search agent algorithms such as Breadth First Search, Depth First Search, A*, etc.
Website
Description and Features
I originally designed my own website in WordPress using a template and Elementor. Finally I decided to redesign it completely outside WordPress, coding it manually without using any frameworks. For example, the picture carrousel has been programmed directly in HTML and JavaScript.
Website
Description and Features
This website was typed manually without using any frameworks. For example, the picture carrousel has been programmed directly in HTML and JavaScript.
A personalized icon is used for the location in Google Maps.
Description
This app is similar to the corresponding Object Pascal one, which has been coded from this one (adding object-oriented and other features).
Refer to the Object-Pascal section for further description.
Features
Although the Object Pascal homologous app, which has been produced from this one, has some additional features, there are still other features which are exclusive of this Fortran version.
For example a module for generating an input file for the HEC-RAS software. HEC-RAS is a high-performance software for hydraulic assessment, but the data input can be tedious, unless a GIS external tool is used. This version of Delaunay provides that functionality, been able to generate cross sections from a topographical survey (which can be polygonal), and generate the corresponding input file for HEC-RAS.
Future planned features
I had plans for integrating additional functionality into this app, mainly related to the hydraulic assessment field (e.g. real-time iteration with HEC-RAS for providing really advanced functionality).
Nevertheless, finally I developed the homologous Delaunay app in Object Pascal, and the Fortran one is not further progressed.
Description
This app is able to read an AutoCAD .dxf file, getting all the parameters of any kind of supported elements within a .dxf cad file, and obtaining from them the corresponding 3D geometry, which finally is converted to 3D polylines according to the specified parameters.
The obtained 3D polylines can be stored in a new .dxf file or in plain text files.
This module has been integrated within the above Delaunay app, and rewritten in Ojbect Pascal with the same purpose.
Features
The most relevant feature of this app consists of the advance algorithms defining complex geometrical operations (e.g. getting the geometry of an arc of an ellipse defined within a different coordinate system, and only defined by a few parameters within the .dxf file; or getting the geometry of a 3D spline from its parameters).
The app allows the user to work in different coordinate systems: when an object has been defined in a different coordinate system, the designed algorithms are able to extrapolate the information to the current coordinate system and get its projected geometry.
Description
This app generates the convex envelope of a cloud of 3D points (working in 2D, as Z is considered a property).
This module has been integrated within the above Delaunay app, and rewritten in Ojbect Pascal with the same purpose.
Features
It can process an undefined huge amount of points (millions), and is able to filter these (according to the user parameters) before generating the convex envelope.
The algorithms have been designed to deal with aligned points and other singular circumstances, and to provide the highest possible performance.
Description
Given a point (coordinates X, Y), this app is able to identify the polygon which contains it.
This app has been designed to be integrated within a larger piece of software, which purpose were, for example, to identify the council corresponding to a given point (specified by its coordinates), and then get properties from databases, such as seismic parameters, etc.
Features
The app is able to search within complex polygons, whatever irregular geometry and whatever number of segments defining the border. There can be an undefined huge amount of polygons (millions), with the only condition of not having gaps/voids between them. The algorithm proceeds with searching the correct polygon containing the given point, starting from a certain polygon and addressing the searching to the convenient neighbours.
As a consequence of the implemented algorithms, the searching is extremely efficient, even in the case of having millions of polygons, each one with hundreds or thousands of line segments defining its contour.
Description
This app solves a System of Linear Equations, working with the corresponding matrices.
Features
It works with whatever dimension of the system, providing efficient ways of storing and transforming the matrices for getting the solution.
Description
This AutoCAD script provides several functions such as designing a road alignment (plan axis), including consecutive circular curves, clotoids and straight segments; exporting 3D data from a group of selected entities; etc.
Features
A clotoid is already a complex geometric entity, when defined parallel to one of the main axis. But even more complex when it is part of a road alignment, between circular curves with a disposition non-parallel to a main axis.
Future planned features
This script was pretended to be part of a large set of tools for designing road alignments directly in AutoCAD. Finally I progressed other projects using other programming languages and this was not further developed.